New Hyde Park Memorial High School and Great Neck South High School are located less than three miles apart, but the difference between how much their respective districts spend per student is far greater.
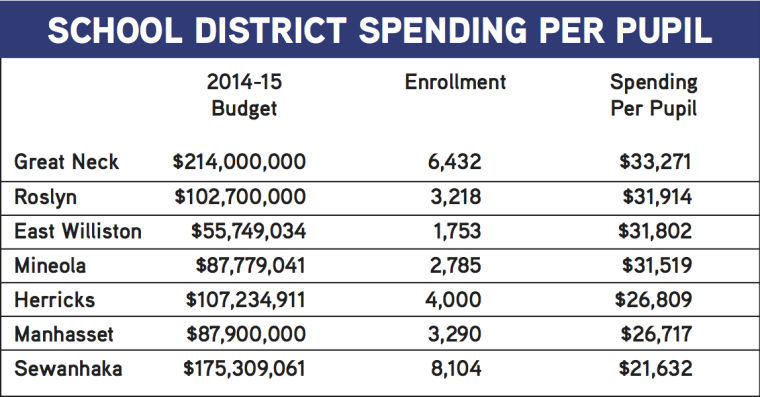
Great Neck School District will spend $33,271 per student during the 2014-15 school year, a figure Blank Slate Media calculated by dividing the district’s projected enrollment into its proposed budget, while the Sewanhaka School District which funds New Hyde Park Memorial High School will spend just $21,632.
Great Neck and Sewanhaka represent the largest disparity in spending among the seven North Shore school districts that Blank Slate Media analyzed for this story but not the only disparity. Per pupil costs range for the Roslyn, East Williston, Mineola, Herricks and Manhasset school districts range between $26,000 and $32,000.
Roslyn was second behind Great Neck at $31,914 per student, East Williston was third at $31,802, Mineola was fourth at $31,519, Herricks was fifth at $26,809 and Manhasset was sixth at $26,717.
The school districts vary in accepted the methodology used to determine their per pupil costs, with some taking figures generated by the Nassau BOCES program and others taking numbers calculated by the state Department of Education. The latest year for which these statistics are available also varied among the districts from 2011-12 to 2012-13 depending on the accepted methodology.
Great Neck Superintendent Tom Dolan and Sewanhaka Superintendent Ralph Ferrie each said Blank Slate Media’s calculations are somewhat skewed.
“We’re not comparing apples to apples here,” he said, noting that the spending needs of each district are different because Sewanhaka is comprised of five high schools while Great Neck has nine schools at elementary and secondary levels.
Ferrie agreed with Dolan’s assessment, saying the costs to educate high school students are greater than those needed to educate younger students.
But, he said, the differences in spending among the districts was real and would soon begin have consequences of its students if it wasn’t already.
Ferrie said the biggest issue facing Sewanhaka is the pressure in calculating an annual budget with decreased state aid and a mandated tax cap that still meets his district’s benchmarks for academic excellence.
While Sewanhaka does not plan to cut any academic programs as part of its $173.59 million proposed budget for the 2014-15 school year, it does plan to eliminate 27 district employees, including 13 full-time teaching positions.
“This is going to start creating inequity if we have to cut student programs, and I’ve very concerned about that,” Ferrie said. “The one thing we’re fortunate with here in Sewanhaka is we have excellent teachers and administrators and support parents.”
Dolan, a previous Sewanhaka superintendent of schools, declined to comment about the disparity in the two districts’ costs per student, saying, “I’m not in a position to comment on how they arrived at their figures.”
Several school districts, including Great Neck and Sewanhaka, do not calculate their own costs-per-student but instead use figures taken by Nassau BOCES or the state.
Kevin O’Brien, Sewanhaka’s assistant superintendent for finance and operations, said the district uses the latest figures calculated by BOCES, which are determined by dividing its actual expenditures into enrollment.
O’Brien said Sewanhaka spent $18,794 per student in 2012-13, the latest year for which BOCES has calculations, ranking 54th out of the 57 school districts in Nassau County.
Manhasset Assistant Superintendent for Business Rosemary Johnson also said her district uses BOCES figures. In 2012-13, Manhasset’s $27,007 ranked 18th in Nassau County in costs per pupil.
But Johnson said Manhasset’s costs per pupil have decreased since 2005-06, even though it spent approximately $3,000 less per student. In 2005-06, Manhasset was ranked fourth by BOCES in costs per pupil.
“What it shows is that Manhasset has over the years consistently operated on an efficient basis and reduced its costs per pupil despite changes in the state and the district,” Johnson said.
Manhasset Superintendent of Schools Charles Cardillo said that in the years since 2005-06, the district has weathered many new challenges, including increasing enrollment, declining state aid, and turnover within its administration.
“It was a point of pride in a different era that you could say you were providing programs and facilities and not spend as much,” he said. “In a positive sense, 10 years later, things have changed, so people look at these things in a much different manner.”
Blank Slate Media calculated Manhasset’s 2014-15 costs per student at be $26,717.
Great Neck Assistant Superintendent for Business Jonathan Powell said the per student cost was not calculated by the school district, but by the state.
According to the state education department’s website, Great Neck spent $16,243 for its general student population and $47,991 for every special education student in the 2011-12 school year, the latest year for which complete figures are available.
But Dolan and Powell said even at the $33,281 figure, they believed Great Neck student costs were justified due to the quality of education the district provides.
“I think that the product that the Great Neck students receive is absolutely a superior product and I’m very proud of the education that our students receive,” Dolan said.
Powell added that the school district would like to spend less, but was faced with the difficulty of keeping up with state-mandated increases in pension and health care costs.
Powell also said the school district was also faced with a low amount of state aid funding.
“Historically, we receive very low amounts of state aid funding,” he said.
Michael Frank, the assistant superintendent for business at the New Hyde Park-Garden City Park School District, said he considers the state’s 2012-13 calculation of $20,051 to be reliable, though they are not official figures.
Herricks Superintendent of Schools John Bierwirth said he doesn’t dwell on the economic disparity between well-heeled school districts with sizable commercial bases and districts like Herricks with virtually no commercial base.
“It’s a reality that we’ve learned to live with knowing that it’s highly unlikely to change,” Bierwirth said. “If you want to get frustrated about it, you can, but it’s not going to change. That’s not something we spend a lot of time thinking about.”
The tax cap impact on Herricks has manifested itself in the 100 jobs it has eliminated over the past three years, including 63 teaching positions. The district has gained a reprieve this year, with the prospect of adding seven teaching in the wake of enduring the large numbers of job losses.
Bierwirth said historically, Herricks has spent more on special education than other districts. And he doesn’t foresee a solution to the general trend dictated by a cap compounded with unfunded mandates.
“When something is mandated, it has to be taken away from something else,” Bierwirth said. “We certainly work for as much state aid as we can, but I don’t see that will change drastically in the future.”
Based on 2012-13 state figures, Herricks’ cost per student for all students was $24,478 as it spent $53,555 for each special education student.
Like Herricks, the East Williston School District has complied with the tax cap without suffering the fallout of lost teaching jobs.
But East Williston Superintendent of Schools Elaine Kanas said the district will be hard pressed to maintain its range of academic programs without some change in the existing economic formulas.
“If we only have a certain amount of money that comes in and we’re told to do more things, then we would have to cut programs,” Kanas said “If state aid was more reliable, that would help. We don’t know from one minute to the next what our state aid is going to be.”
Kanas said the virtual absence of a commercial base in the East Williston district creates a burden for the district and its taxpayers, despite the district’s best efforts to hold down the tax levy, which is projected to rise 2.43 percent in the 2014-15 school year.
“What’s more challenging is that the levy is not the tax bill because homes are assessed in different ways. Some people have a 1 percent increase and some people have a 6 percent increase,” she said. “That becomes difficult and complicated for homeowners and the district.”
While Blank Slate calculated East Williston’s per student cost at $31,802, Jacqueline Pirro, East Williston assistant superintendent for business, said the district bases its average of $29,921 for all students based on the final expenditures for the 2012-13 school year and the 1,747 students enrolled in the district at that time.
Mineola Assistant Superintendent for Business Jack Waters acknowledges that the Village of Mineola has a “strong” commercial tax base representing 40 percent of property tax revenues “that takes part of the burden off the residential owner.”
Waters said good fiscal management has enabled the district to maintain tax levy increases of 2.5 percent or less over the past five years while building new library additions at two of its elementary schools, at Hampton Street and Meadow Drive.
“We believe we’ve given Mineola taxpayers a very good bang for their buck and giving students a good education while keeping the tax levy low,” Waters said.
He said the Mineola district doesn’t calculate a cost per student.
“We don’t look at it on a cost per student basis. We just don’t do that,” Waters said. “We don’t care about cost per student because everything is part of the process.”